About This Product
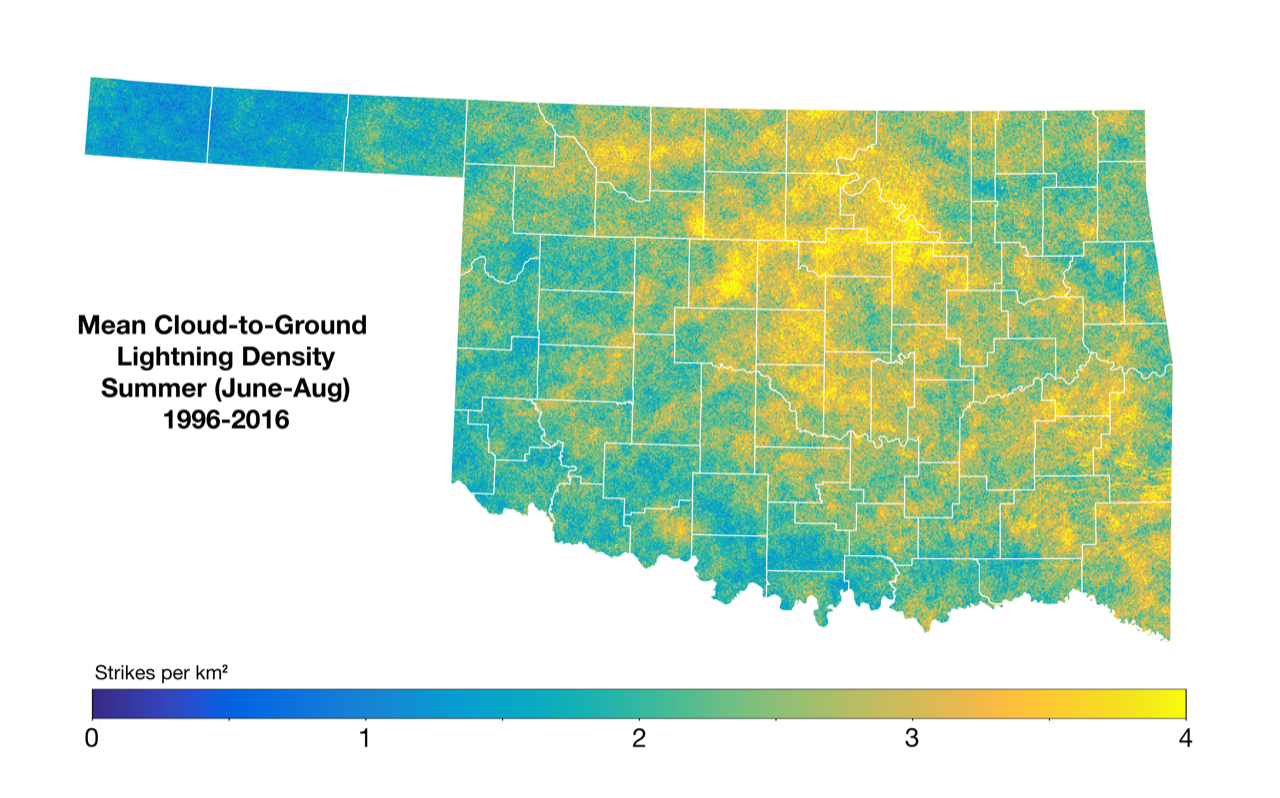
This map was created by Dr. Kristin Calhoun (National Severe Storms Laboratory and the Cooperative Institute for Mesoscale Meteorological Studies) and shows the mean cloud-to-ground lightning density for the summer season (June-August) from 1996-2016 for Oklahoma. The color scale represents the density of strikes per kilometer squared. The data have been provided by the Vaisala National Lightning Detection Network.