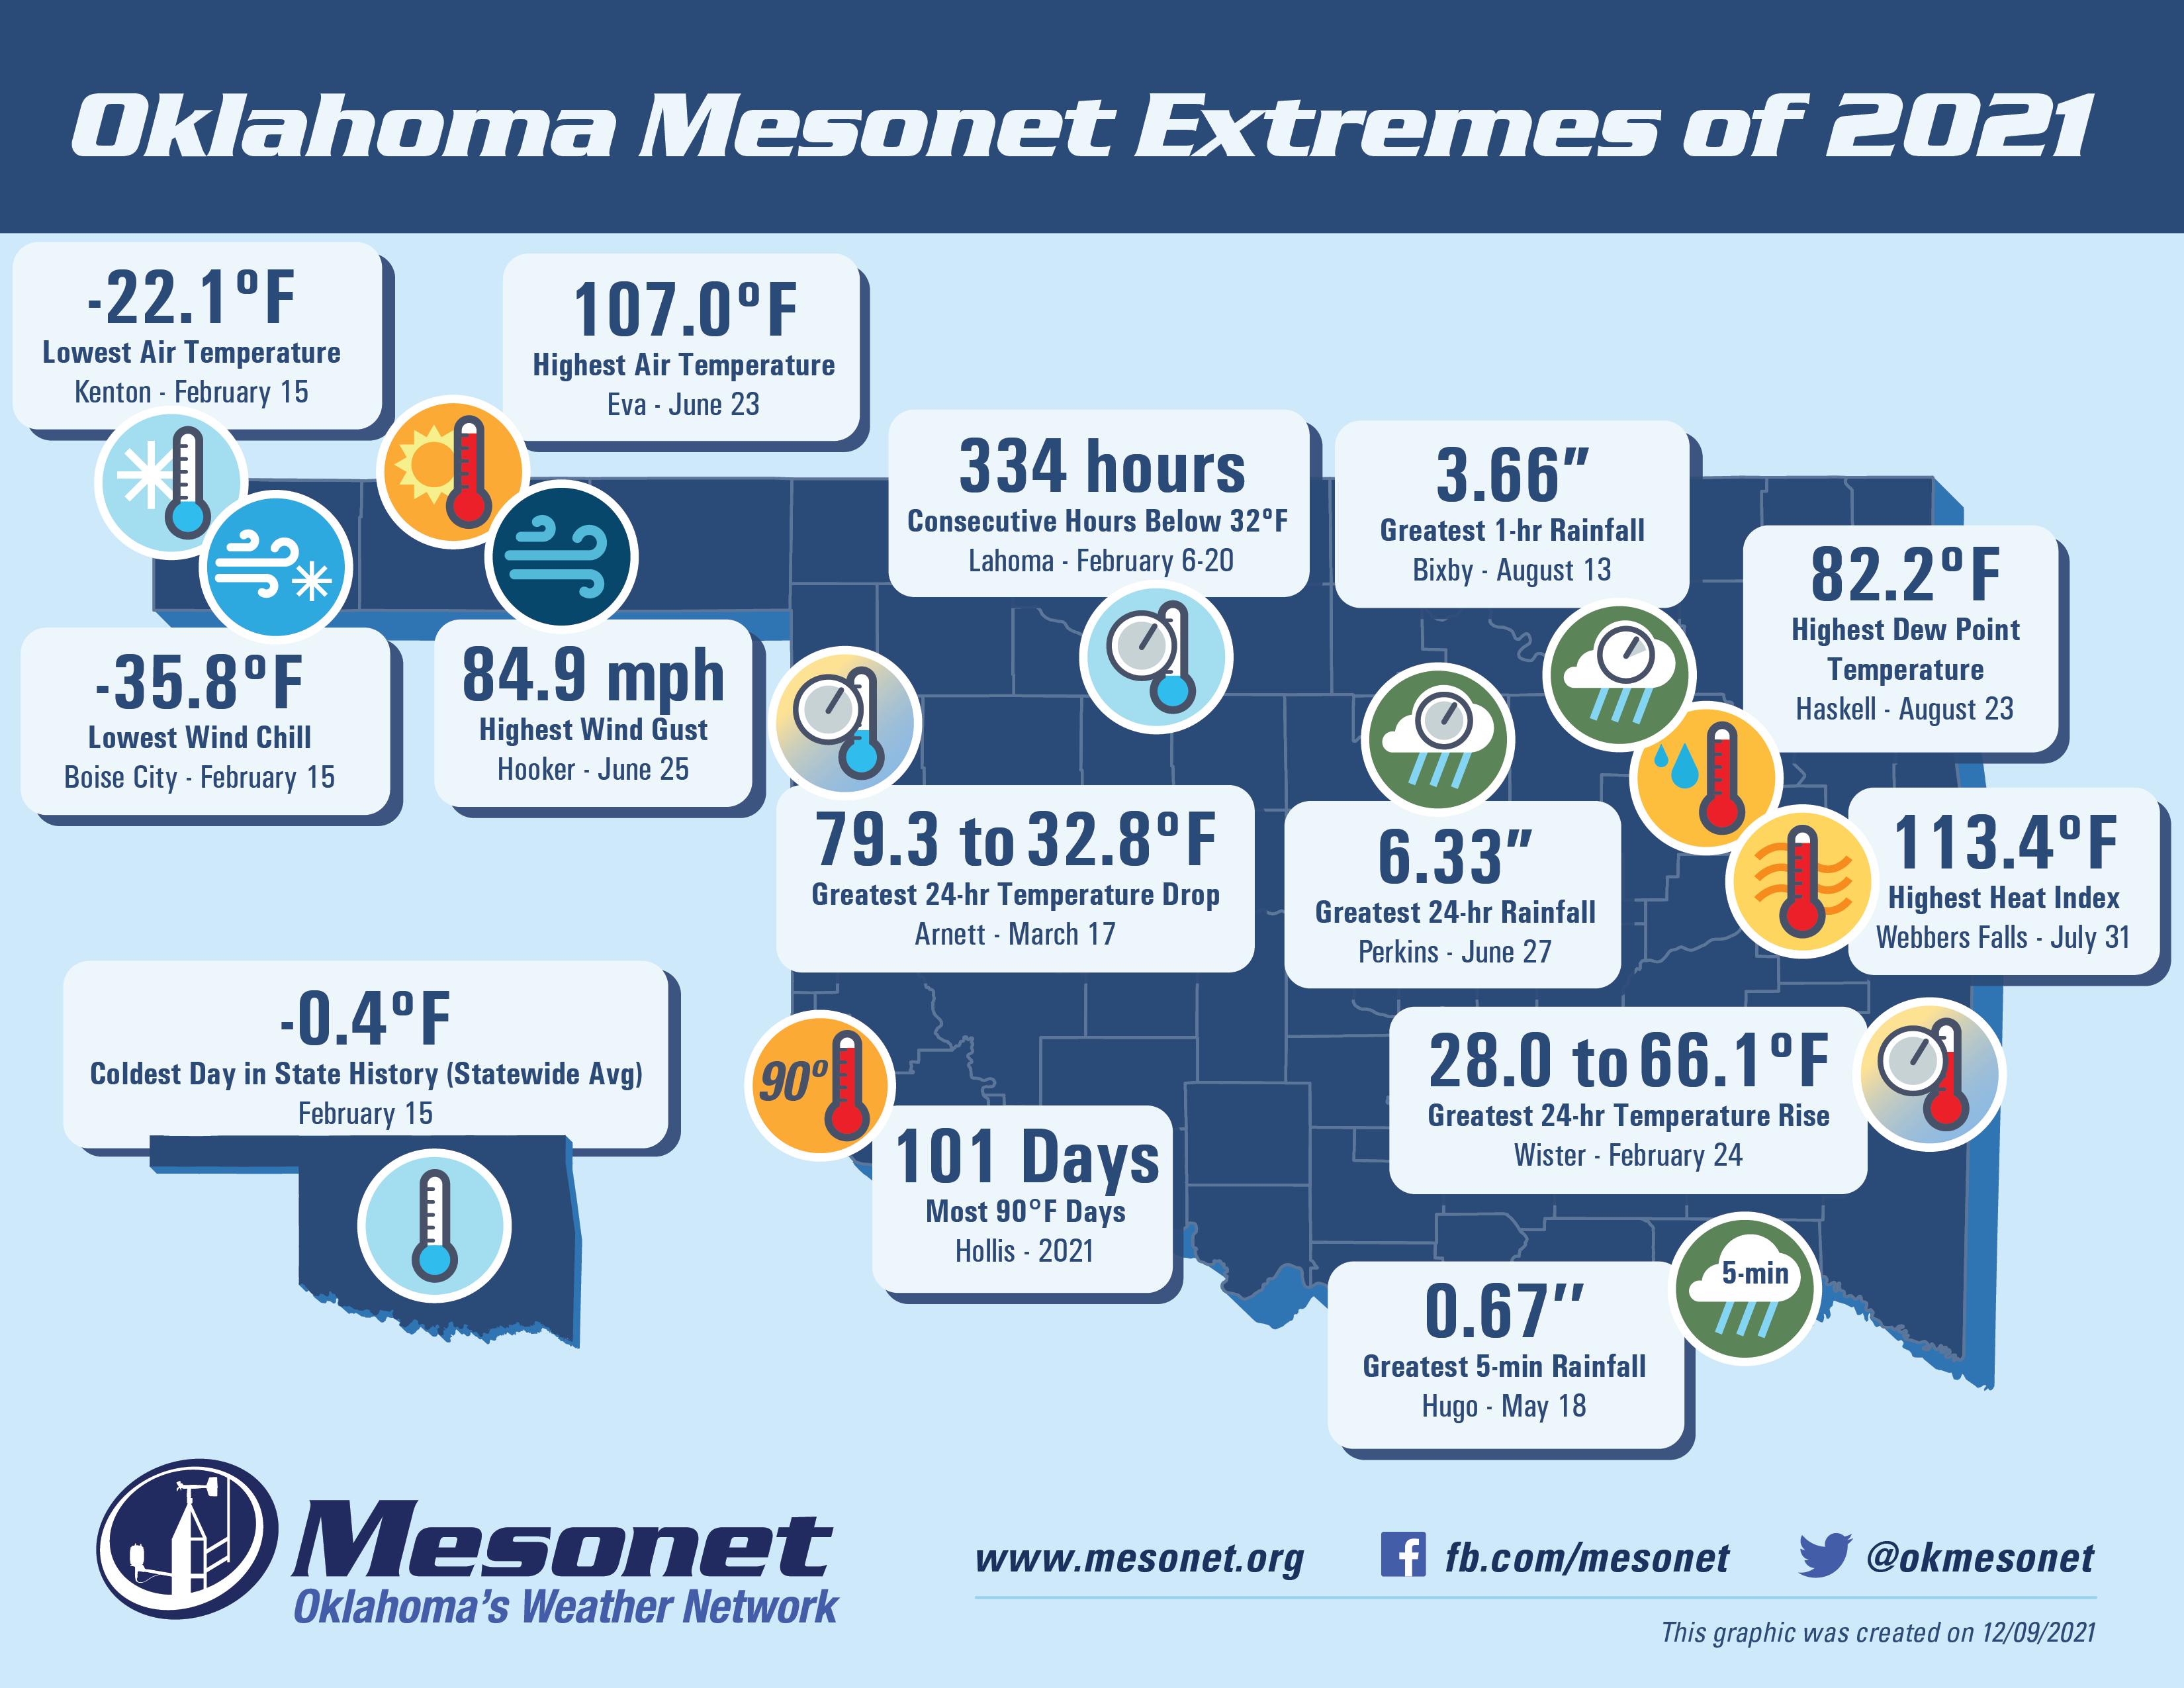
Each year the Oklahoma Mesonet creates a map showing the most extreme events that were recorded by the network throughout the year. In a year of wild weather, we identified 14 extremes that really stood out:
- Statewide - Coldest Day in State History (Statewide Avg): -0.4°F on February 15
- Arnett - Greatest 24-hr Temperature Drop: 79.3°F to 32.8°F on March 17
- Boise City - Lowest Wind Chill: −35.8°F on February 15
- Bixby - Greatest 1-hr Rainfall: 3.66" on August 13
- Eva - Highest Air Temperature: 107.0°F on June 23
- Haskell - Highest Dew Point Temperature: 82.2°F on August 23
- Hooker - Highest Wind Gust: 84.9 mph on June 25
- Hollis - Most 90°F Days: 101 days
- Hugo - Greatest 5-min Rainfall: 0.67" on May 18
- Kenton - Lowest Air Temperature: −22.1°F on February 15
- Lahoma - Consecutive Hours Below 32°F: 334 hours from Feburary 6 to 20
- Perkins - Greatest 24-hr Rainfall: 6.33" on June 27
- Webbers Falls - Highest Heat Index: 113.4°F on July 31
- Wister - Greatest 24-hr Temperature Rise: 28.0°F to 66.1°F on February 24
This graphic was created on December 9, 2021.