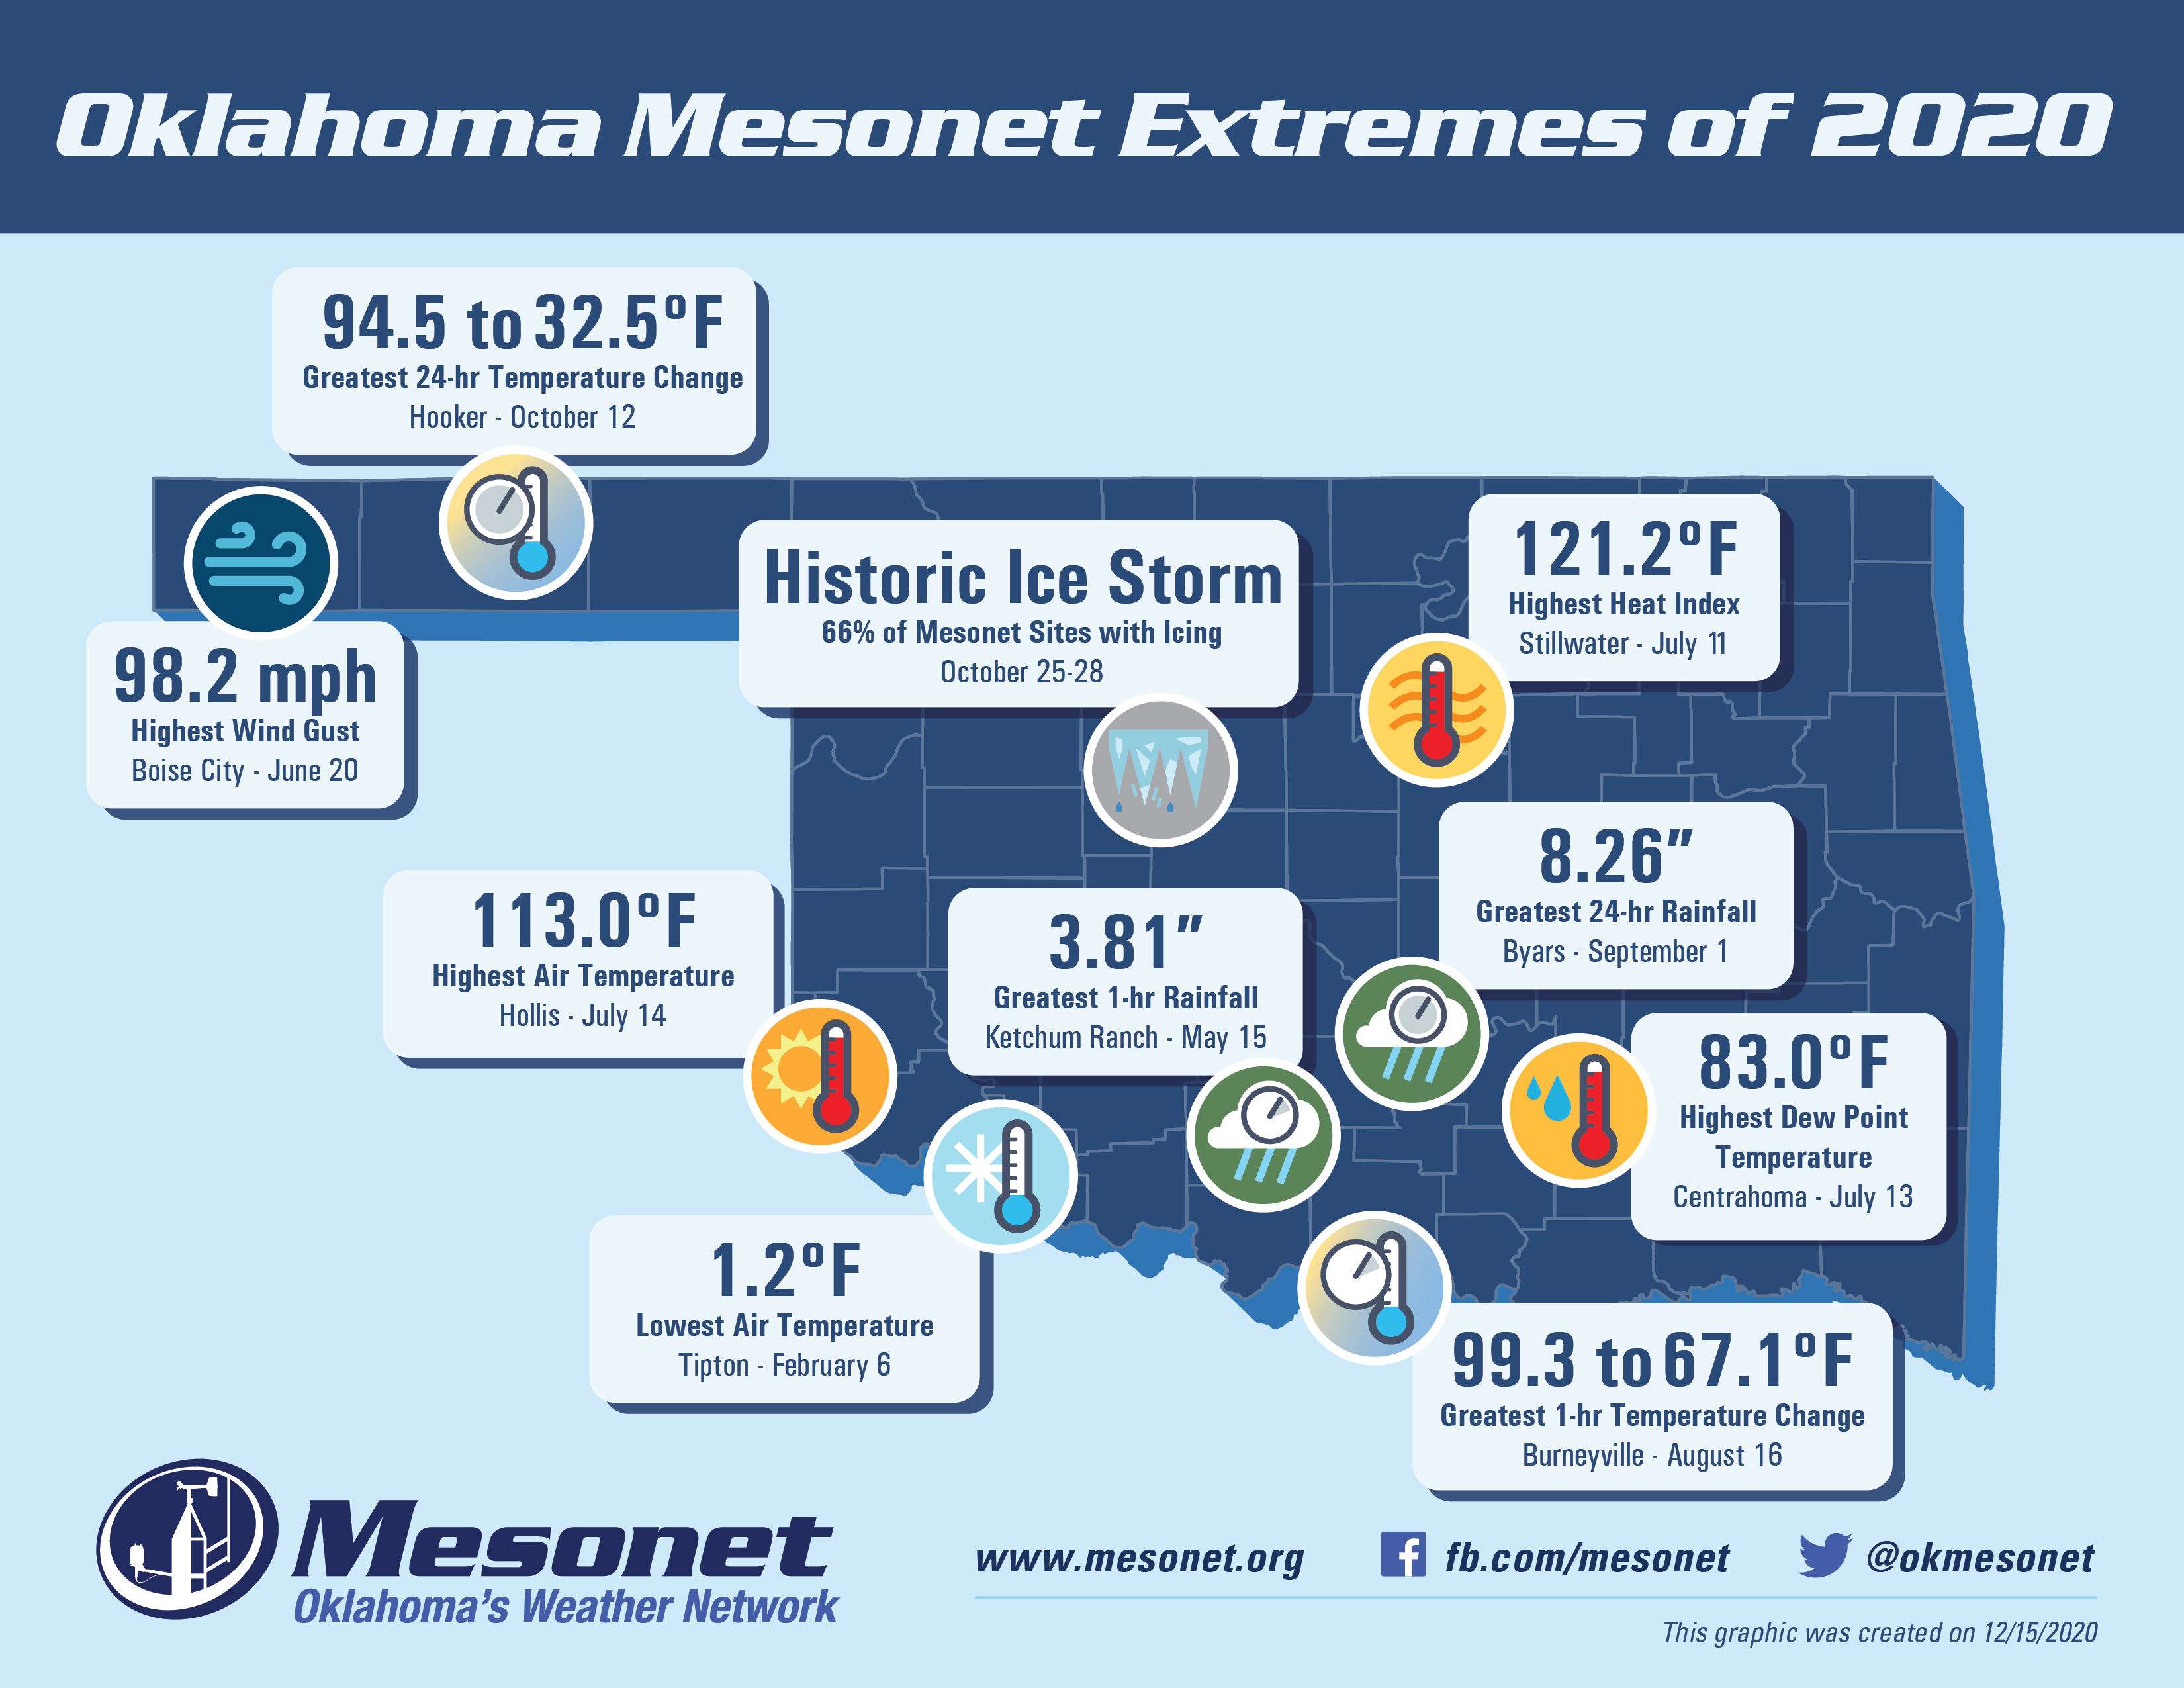
Each year the Oklahoma Mesonet creates a map showing the most extreme events that were recorded by the network throughout the year. In a year of wild weather, we identified 10 extremes that really stood out:
- Statewide - Historic Ice Storm: 66% of Mesonet Sites with Icing on October 25 to 28
- Boise City - Highest Wind Gust: 98.2 mph on June 20
- Burneyville - Greatest 1-hr Temperature Change: 99.3°F to 67.1°F on August 16
- Byars - Greatest 24-hr Rainfall: 8.26" pm September 1
- Centrahoma - Highest Dew Point Temperature: 83.0°F on July 13
- Hooker - Greatest 24-hr Temperature Change: 94.5°F to 32.5°F on October 12
- Hollis - Highest Air Temperature: 113.0°F on July 14
- Ketchum Ranch - Greatest 1-hr Rainfall: 3.81" on May 15
- Stillwater - Highest Heat Index: 121.2°F on July 11
- Tipton - Lowest Air Temperature: 1.2°F on February 6
This graphic was created on December 15, 2020.