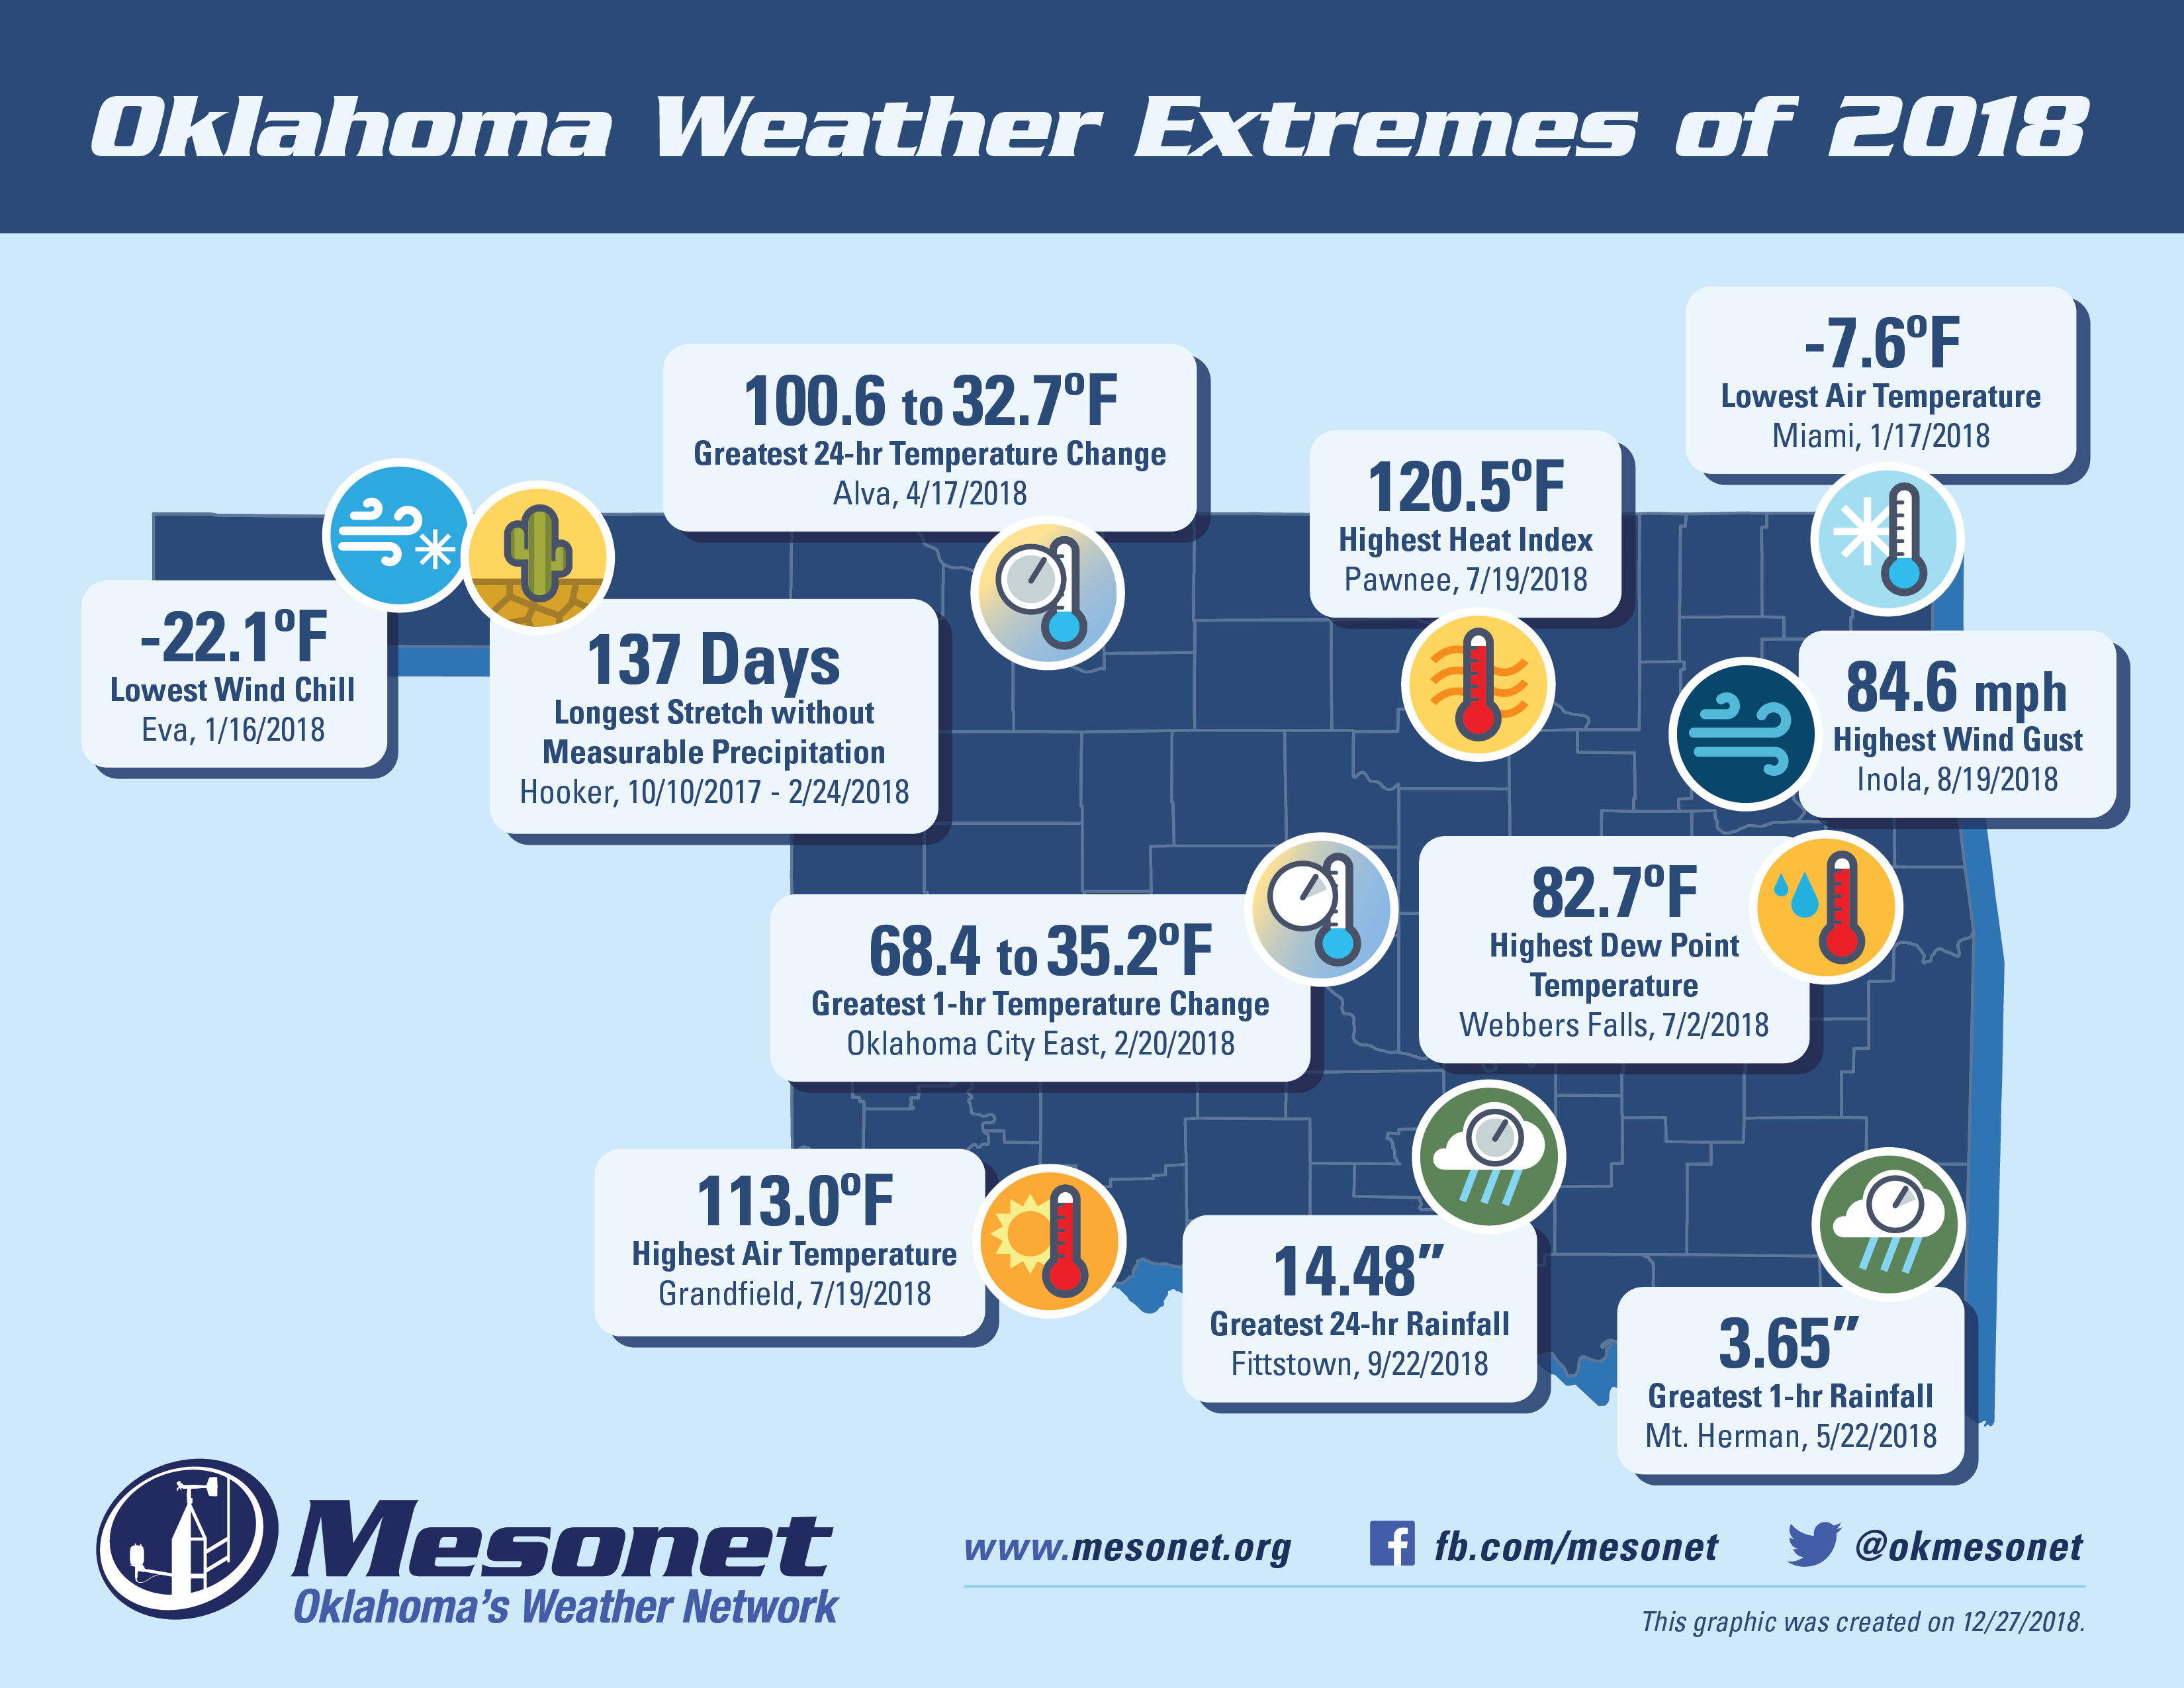
Each year the Oklahoma Mesonet creates a map showing the most extreme events that were recorded by the network throughout the year. In a year of wild weather, we identified 11 extremes that really stood out:
- Alva - Greatest 24-hr Temperature Change: 100.6°F to 32.7°F on April 17
- Eva - Lowest Wind Chill: −22.1°F on January 16
- Fittstown - Greatest 24-hr Rainfall: 14.48" on September 22
- Grandfield - Highest Air Temperature: 113.0°F on July 19
- Hooker - Longest Stretch without Measurable Precipitation: 137 days October 10, 2017 to February 24, 2018
- Inola - Highest Wind Gust: 84.6 mph on August 19
- Miami - Lowest Air Temperature: −7.6°F on January 17
- Mt. Herman - Greatest 1-hr Rainfall: 3.65" on May 22
- Oklahoma City East - Greatest 1-hr Temperature Change: 68.4°F to 35.2°F on February 20
- Pawnee - Highest Heat Index: 120.5°F on July 19
- Webbers Falls - Highest Dew Point Temperature: 82.7°F on July 2
This graphic was created on December 27, 2018.