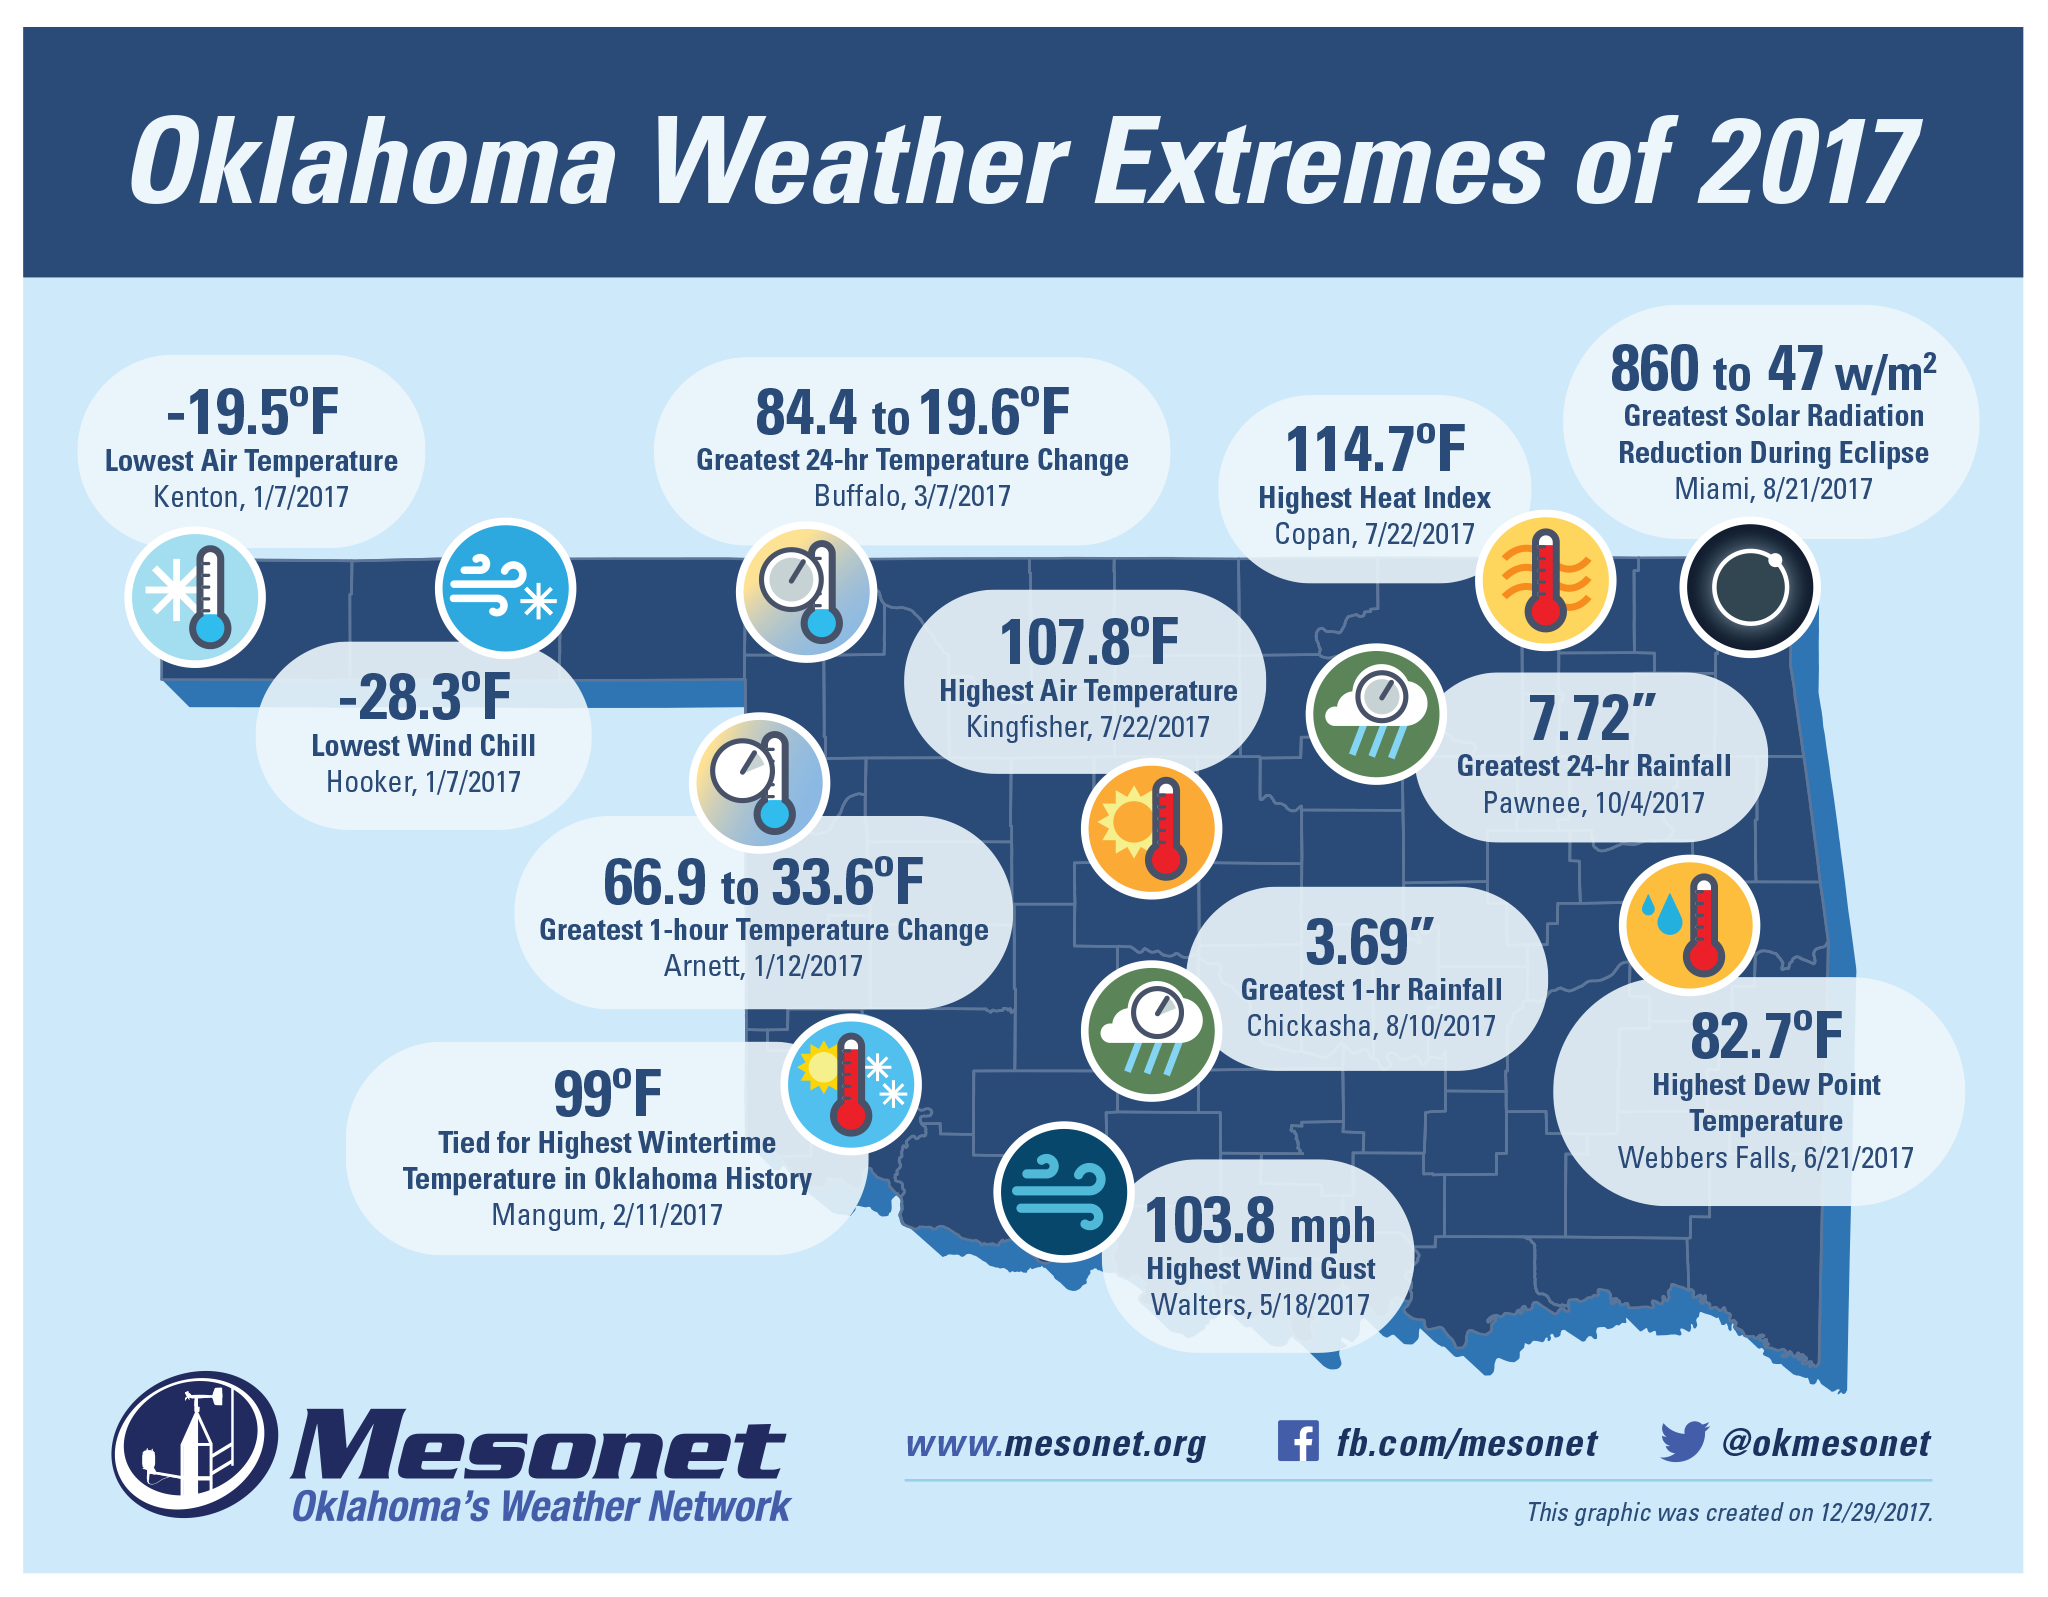
Each year the Oklahoma Mesonet creates a map showing the most extreme events that were recorded by the network throughout the year. In a year of wild weather, we identified 12 extremes that really stood out:
- Arnett - Greatest 1-hr Temperature Change: 66.9°F to 33.6°F on January 12
- Buffalo - Greatest 24-hr Temperature Change: 84.4°F to 19.6°F on March 7
- Chickasha - Greatest 1-hr Rainfall: 3.69" on August 10
- Copan - Highest Heat Index: 114.7°F on July 22
- Hooker - Lowest Wind Chill: −28.3°F on January 7
- Kenton - Lowest Air Temperature: −19.5°F on January 7
- Kingfisher - Highest Air Temperature: 107.8°F on July 22
- Mangum - Tied for Highest Wintertime Temperature in Oklahoma History: 99°F on February 11
- Miami - Greatest Solar Radiation Reduction During Eclipse: 860 W/m² to 47 W/m²
- Pawnee - Greatest 24-hr Rainfall: 7.72"
- Walters - Highest Wind Gust: 103.8 mph on May 18
- Webbers Falls - Highest Dew Point Temperature: 82.7°F on June 21
This graphic was created on December 29, 2017.