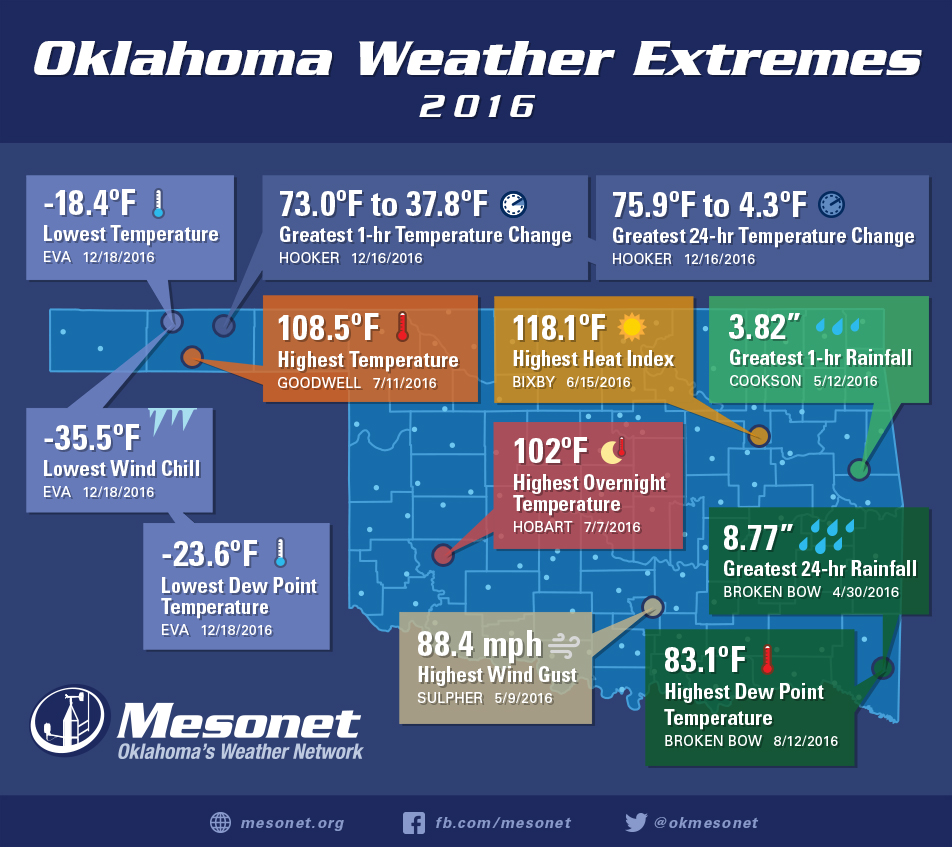
Each year the Oklahoma Mesonet creates a map showing the most extreme events that were recorded by the network throughout the year. In a year of wild weather, we identified 12 extremes that really stood out:
- Bixby - Highest Heat Index: 118.1°F on June 15
- Broken Bow - Greatest 24-hr Rainfall: 8.77" on April 30
- Broken Bow - Highest Dew Point Temperature: 83.1°F on August 12
- Cookson - Greatest 1-hr Rainfall: 3.82" on May 12
- Eva - Lowest Dew Point Temperature: -23.6°F on December 18
- Eva - Lowest Temperature: −18.4°F on December 18
- Eva - Lowest Wind Chill: −35.5°F on December 18
- Goodwell - Highest Air Temperature: 108.5°F on July 11
- Hobart - Highest Overnight Temperature: 102°F on July 7
- Hooker - Greatest 1-hr Temperature Change: 73.0°F to 37.8°F on December 16
- Hooker - Greatest 24-hr Temperature Change: 75.9°F to 4.3°F on December 16
- Sulphur - Highest Wind Gust: 88.4 mph on May 9