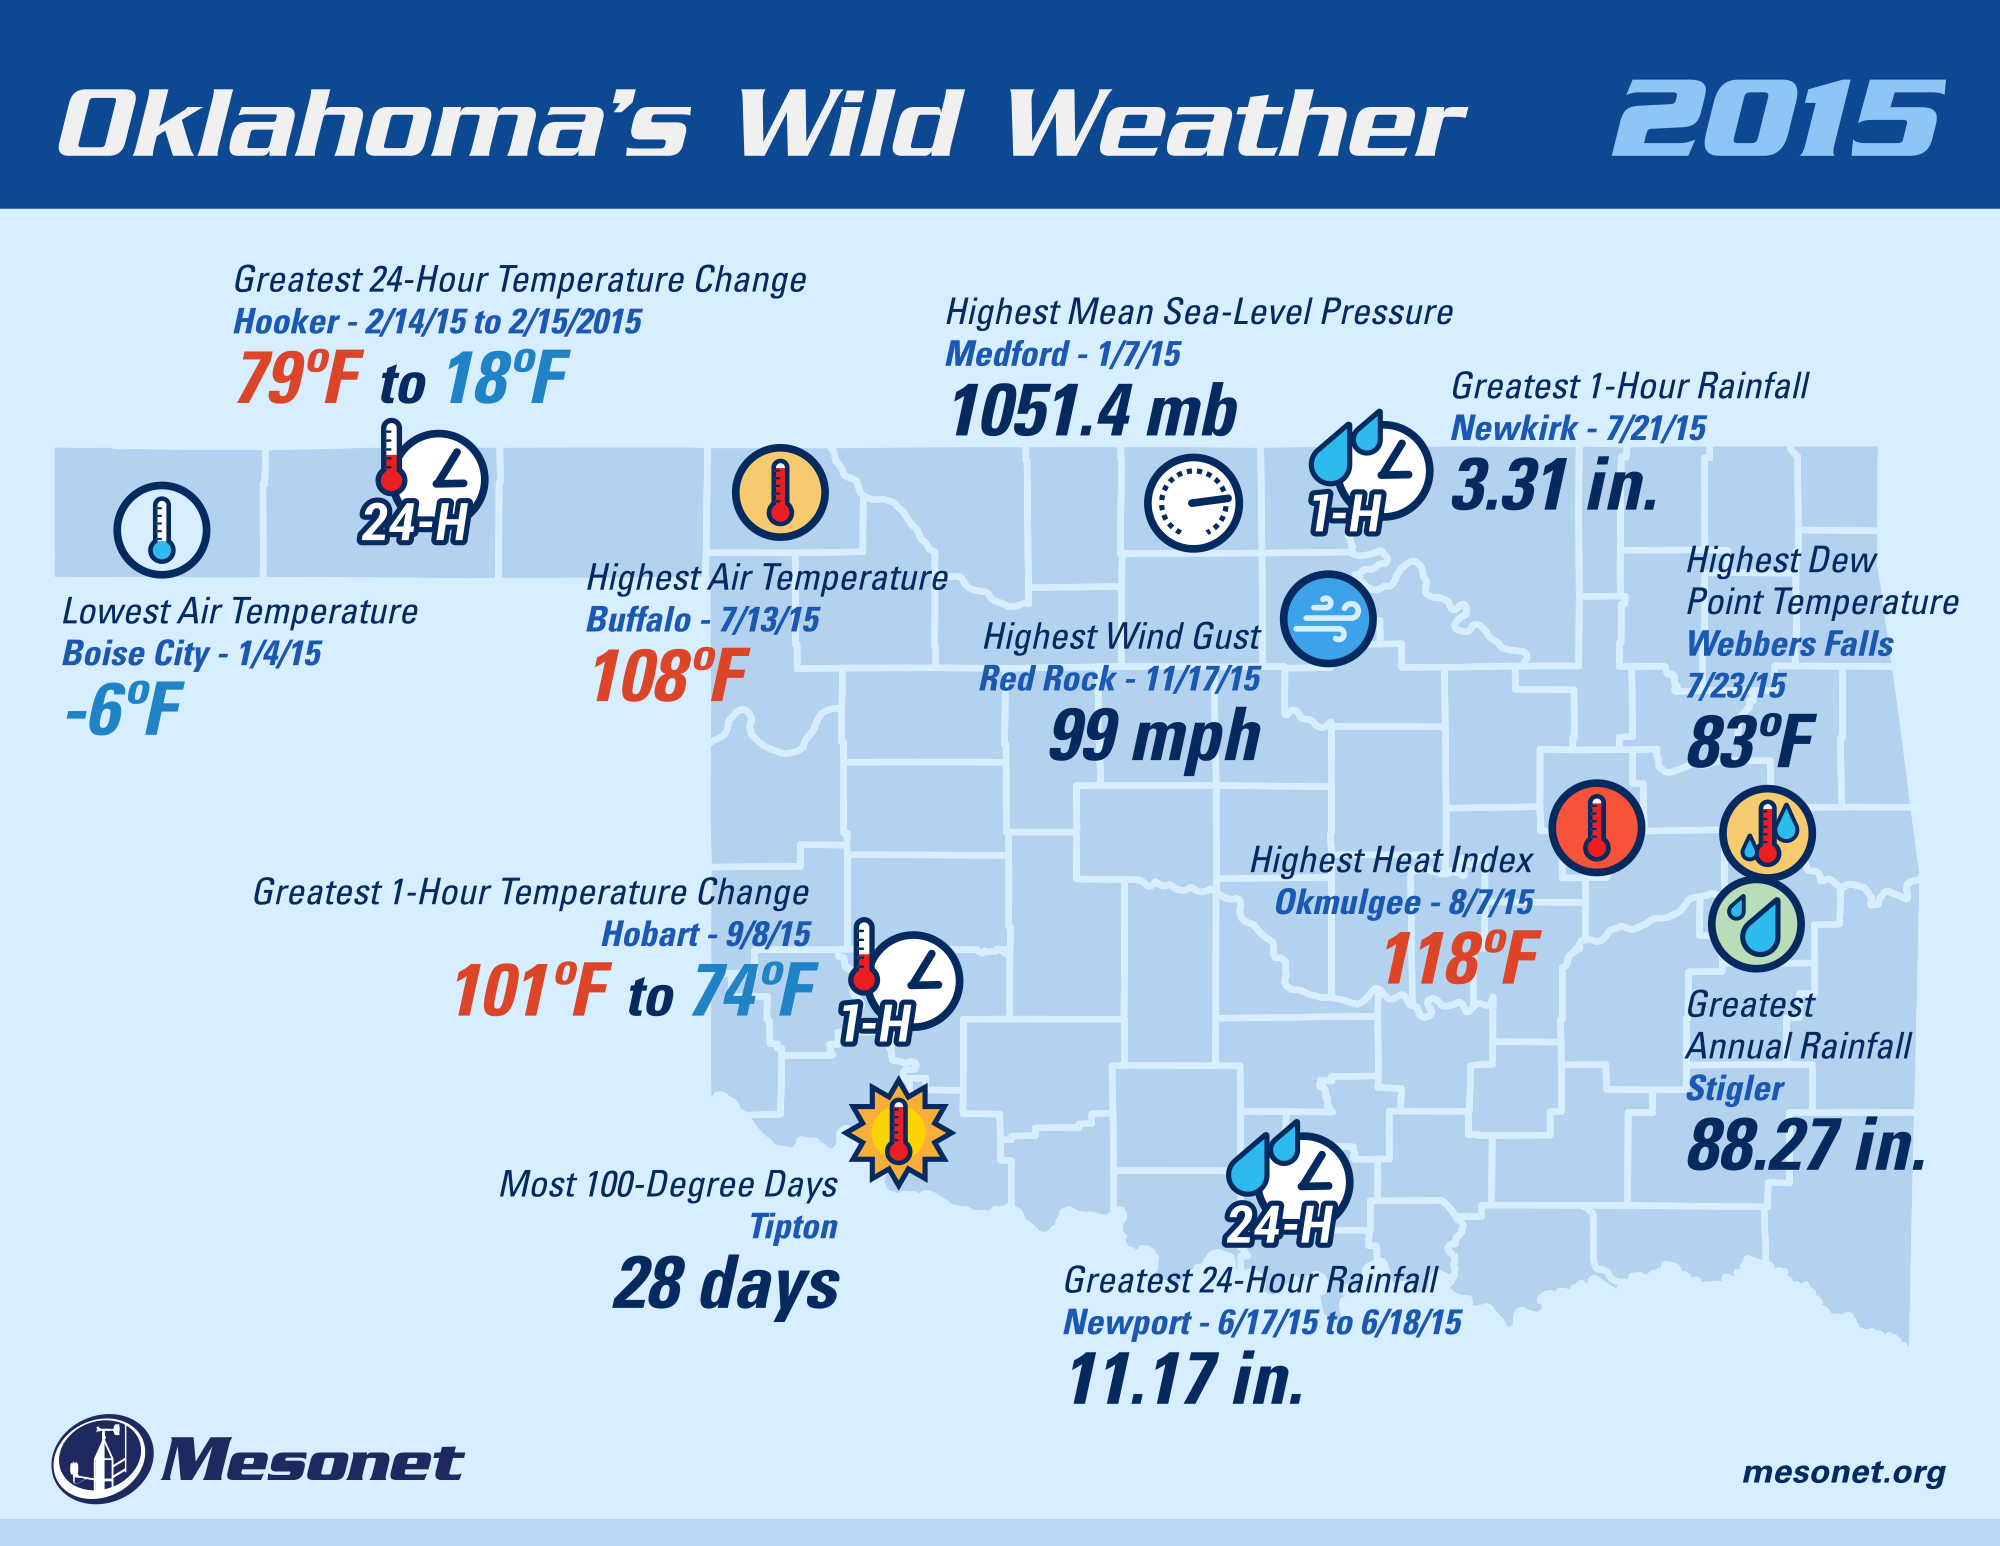
Each year the Oklahoma Mesonet creates a map showing the most extreme events that were recorded by the network throughout the year. In a year of wild weather, we identified 12 extremes that really stood out:
- Boise City - Lowest Air Temperature: −6°F on January 4
- Buffalo - Highest Air Temperature: 108°F on July 13
- Hobart - Greatest 1-hr Temperature Change: 101°F to 74°F on September 8
- Hooker- Greatest 24-hr Temperature Change: 79°F to 18°F on February 14-15
- Medford - Highest Mean Sea-Level Pressure: 1051.4 mb on January 7
- Newkirk - Greatest 1-hr Rainfall: 3.31" on July 21
- Newport- Greatest 24-hr Rainfall: 11.17" on June 17-18
- Okmulgee - Highest Heat Index: 118°F on August 7
- Red Rock - Highest Wind Gust: 99 mph on November 17
- Stigler - Greatest Annual Rainfall: 88.27"
- Tipton - Most 100°F Days: 28 days
- Webbers Falls - Highest Dew Point Temperature: 83°F on July 23